VMI & Oniris - Controlling bread dough formation through mixer's geometry
J. Fontaineab; D. Della Vallea; J. Grua-Priola; J. Cheiob; E.Lancelota; A.Le-Baila
a ONIRIS, UBL, UMR GEPEA CNRS 6144, BP 82225 44322 Nantes – France
b VMI, 85600 Saint Hilaire de Loulay – France
Why should we control bread dough?
 Put simply, the preparation of bread dough is, of course, the conversion of a few dry and liquid ingredients such as flour, salt, yeast. Straight-forward as this may seem to any professional baker, this is an important step in baking since the execution of this process will directly affect the structure and texture of the end product.
The determination of the mixing duration is usually based on the baker's experience, observation of the dough behaviour during mixing and dough manipulation that permits the assessment of the dough cohesiveness and elasticity and, therefore, the resulting degree of gluten network formation. In some cases, where dough is destined to undergo lamination, a lower degree of gluten network is required since the sheeting process will further contribute to its formation.
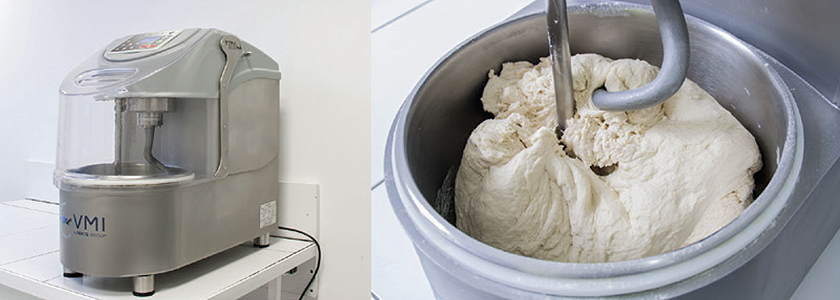
Figure 1: Dough during mixing in a spiral mixer (VMI-France: Adrien Rebillard)
The key tasks performed by the mixer are:
- - dispersion of the ingredients homogeneously
- - transfer of mechanical energy to the dough in order to ensure the development of the gluten network
- - incorporation of air bubbles and, where possible, control of their size and distribution
- - partial removal of the heat produced by the viscous friction to limit the dough temperature
The dispersion of ingredients is achieved during a "pre-mixing" phase at low speed; this step ends when the ingredients are properly mixed. The second phase called the "mixing" step is carried out with a higher tool speed. Several biochemical phenomena yield the formation of an isotropic gluten network which embeds miniature gas cells in the dough. The control of the number and size of the air bubbles in the gluten network is crucial with respect to the overall baking process (Koksel et al. 2016; Jha et al. 2017).
As a whole, the formulation, the mixer design and the process parameters control the dough formation, therefore, it is essential to understand the link between mixer and dough properties.
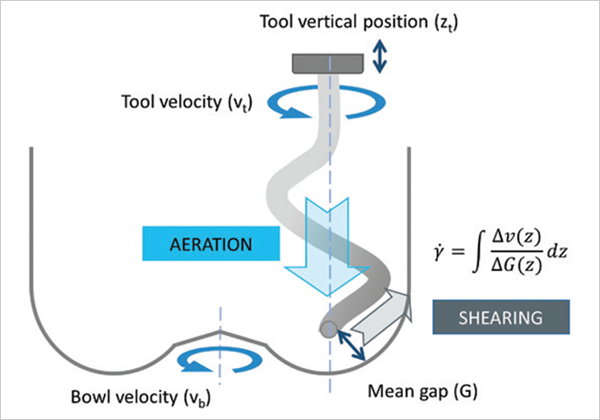
Figure 2: The spiral mixing tool motion generates a 3D flow in the bowl, inducing two main contributions to the shear rate: a tangential shearing linked to the speed difference between the spiral and the bowl and an axial shearing [along the axis of the spiral]. The resulting shear rate in the contact region depends on the respective speeds of the tool and bowl rotation and on the gap between the bowl and the spiral. The downward movement of the spiral is considered as the main gas intake mechanism during mixing
Project Objective
The main objective of this project is to investigate the impact of two process parameters – spiral speed and spiral-bowl gap on the mixing time, the dough microstructure and the kinetics of dough aeration.
Mixing Monitoring
The real-time monitoring of dough during mixing allows the process to be stopped at the right time. In the present study, a commercial spiral mixer is being used which is equipped with a power meter enabling real-time monitoring of dough development whilst logging power consumption of both bowl and spiral.
A temperature sensor inside the mixer's pivot indicates the dough temperature on a display on the machine.
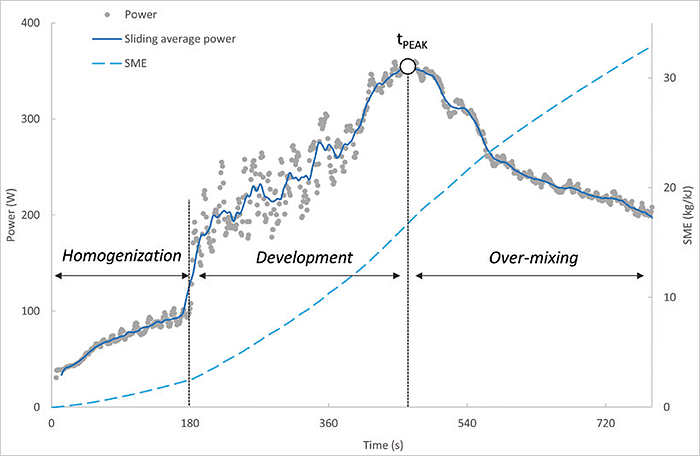
Figure 3: Monitoring of the mixing of sandwich bread dough at 150 rpm. The SME (Specific Mechanical Energy) is obtained from the integration of the power with time during mixing. The tPEAK represents the “time to peak” for which the maximum power consumption is observed; with more energy intake, the protein network progressively collapses
Figure 3 displays a measurement of the tool power against time during mixing giving a relevant indicator for dough viscoelasticity. It is commonly observed that the power increases towards a maximum value called "time to peak" beyond which it decreases due to progressive disruption of the gluten network (overmixing). This optimum time in the power curve was found to be very close to that of the judgment of an experienced baker, however, determining this point using on-line sensors still remains a challenge. The corresponding images of the gluten network obtained for under and over mixing are shown in Figure 4.

Figure 4: CLSM images (1024 x 1024 pixels, 635×635 μm) of dough gluten network at several mixing steps. Red colour are proteins stained with rhodamin B
Mixing Monitoring
Previous research done by Prof. Le-Bail at GEPEA Research group (ONIRIS, Nantes) used changes of pressure in the headspace of a mixer to control the dough aeration.
By mixing at different speeds, they found that the total volume of air incorporated into the dough was proportional to the number of tool rotations needed to reach tPEAK (Sadot et al. 2017)
Nevertheless, further work was carried out on the mixing kinetics of dough aeration. We found that during the mixing step (from pre-mixing to over-mixing), the total volume of air entrapped by the spiral rotation increases linearly with time if no speed change occurs during that phase, until a maximum ΦPEAK occurring slightly after tPEAK.
With the same time sampling, from pre-mixing to over-mixing, the gluten network structure was analysed using Confocal Laser Scanning Microscopy (CLSM) with the protocol by Bernklau et al. (2016) and by staining dough proteins with rhodamin B. Visible changes in the gluten network occurred in accordance with Amend & Belitz (1991) results, with the following main features:
- - gluten proteins appeared to be in a barely hydrated agglomerate state in the beginning
- - the network connectivity densifies progressively during mixing
- - tPEAK seems to be the time for which the gluten network is fully developed and gives its elasticity to dough, corresponding to the maximum torque observed.
Impact of mixer geometry on the mixer performance
Formulation, mixer geometry and process parameters are the three levers to change dough quality. In the industry, it is not always possible to change the recipe and some improvements to dough quality could be obtained by modifications to geometry or process parameters. In this study, the gap between tool and bowl has been varied in a specified range and the tool speed taken at two levels, "low" and "high".
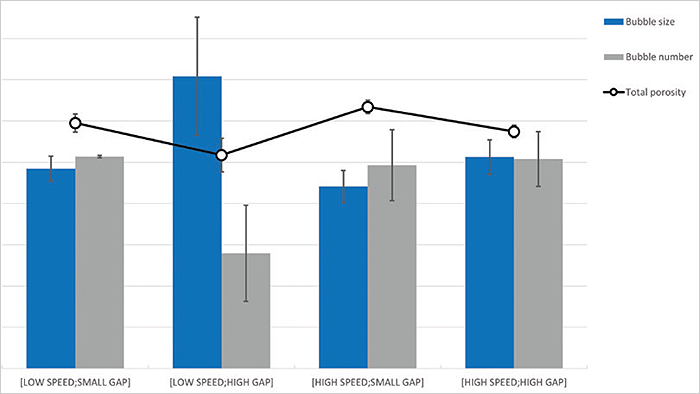
Figure 5: Bubble size, number and total dough porosity obtained for sandwich bread dough stopped at tPEAK by changing a process parameter: tool speed, and a geometry parameter: tool-bowl gap. Results are shown as mean ± standard deviation
Bread dough obtained at tPEAK was analysed both in structure and aeration when the dough is supposed to be at its optimum mixing state or close to it. Some differences arise in the dough, regarding both aeration and protein network structure. The analysis of dough bubbles in light microscopy exhibit a lower bubble number, but of a coarser size, for "low speed-high gap" parameter, corresponding to the lowest shear rate conditions, as seen on Figure 5.
In the same conditions the observation of the microstructure presented in Figure 6, shows a porous dough with the gluten aggregates being barely connected to each other. As shown in this example, increasing the shear rate, either by varying the tool speed or the gap between tool and bowl, is a way to obtain a more structured gluten network, resulting in a higher viscoelasticity, a higher dough aeration and smaller bubbles, leading to a better dough expansion during the proving.
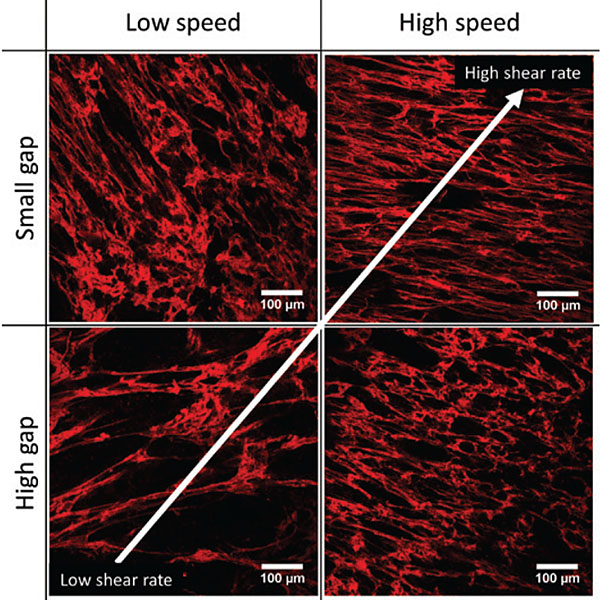
Figure 6: CLSM images (1024 x 1024 pixels, 635×635 μm) of dough stopped at tPEAK after mixed by changing a process parameter: tool speed, and a geometry parameter: tool-bowl gap. Red colour are proteins stained with rhodamin B
Conclusion
The dough properties depend to a large extent on the mixing conditions, a fact that is well known in the baking profession. The present results provide an overview of the influence of the mixing geometry, assessed by objective characterisations and how it can be beneficial to adapt it following the type of product that is to be manufactured.
For instance, for a French baguette, low speed and high gap could be recommended, whilst for a sandwich bread, high speed and small gap is more favourable. Finally, simple mastering of the geometry effects – i.e. the tool position, improves the versatility of the mixing device.
Acknowledgments
This study was carried out in the frame of the project “LABCOM MIXI-LAB” funded by ANR – France (ANR grant n°15-LCV3-0006-01). Joran Fontaine PhD project is supported by ANRT and is co-funded by VMI within the "MIXI-LAB" project. The authors wish to thank Mario Jekle and Isabelle Lucas of TUM with the PNA method (Technische Universität München, Wissenschaftszentrum Weihenstephan für Ernährung, Landnutzung und Umwelt, Germany).
References
Amend, T. & Belitz, H.-D., 1991. Microstructural Studies of Gluten and a Hypothesis on Dough Formation. Food Structure, 10, pp.277–288.
Bernklau, I. et al., 2016. Protein network analysis – A new approach for quantifying wheat dough microstructure. Food Research International, 89, pp.812–819.
Jha, P.K. et al., 2017. Impact of resting time between mixing and shaping on the dough porosity and final cell distribution in sandwich bread. Journal of Food Engineering, 194, pp.15–23.
Koksel, F. et al., 2016. The bubble size distribution and its evolution in non-yeasted wheat flour doughs investigated by synchrotron X-ray microtomography. Food Research International, 80, pp.12–18.
Sadot, M., Cheio, J. & Le-Bail, A., 2017. Impact on dough aeration of pressure change during mixing. Journal of Food Engineering, 195, pp.150–157.
Find out more:
Email: Prof A Le-Bail: alain.lebail@oniris-nantes.fr
Address: VMI - 70 rue Anne de Bretagne, PA des Marches de Bretagne Saint-Hilaire-de-Loulay, 85600 Montaigu Vendee, France
Email: José Cheio: jcheio@vmi.fr
Claire Auffredou: cauffredou@vmi.fr
Website: www.vmimixing.com
3450